How to debug Cloud Run with Visual Studio Code

Cloud Run is one of the most successful solutions that Google Cloud offers to server our serverless applications. But this technology is coming with an issue. How to debug something that is located in the cloud, where we can’t even open a terminal?
Everything has a solution and in this case, we have a solution too, called Visual Studio Code. Let’s see how to able to debug our cloud-run applications with Visual Studio Code.
You're probably not even aware of all the opportunities GCP can provide to your business. We'll show you which solutions will benefit you. About GCP audits
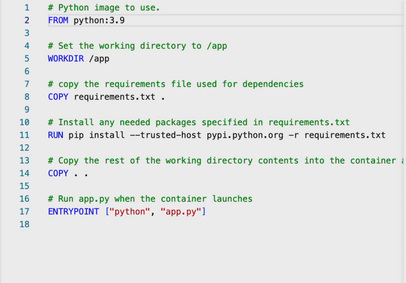
Let’s start. What we are going to do is create a simple python code like the one that you can see on the screen that will simply create a web server and open a page. We will have a Dockerfile where we will simply copy our python file plus requirements, we will install all the requirements and we will run the python code. And this is what it is going to be running in our Cloud run.
Now first, we need to start Visual Code Studio. Visual Studio use extension to be able to work with different functionalities and depends if you ever used those or not you will need to install the python extension to do that we go to extension and write “python” and click on install, later we need to install “cloud code” extension and the last one will be “docker” extension.
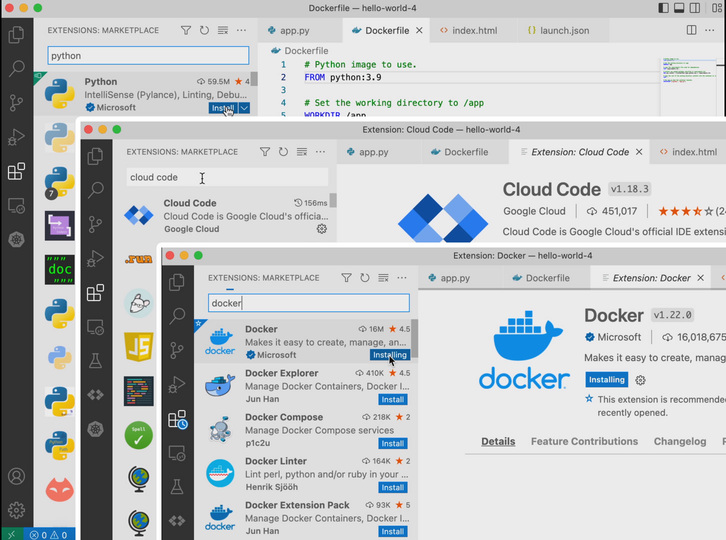
Remember that to be able to execute this debug we will need to have installed “docker” on our laptop.
Now that we have that extension created we need to go to Cloud cloud, down in Visual Studio, and choose “new application”.
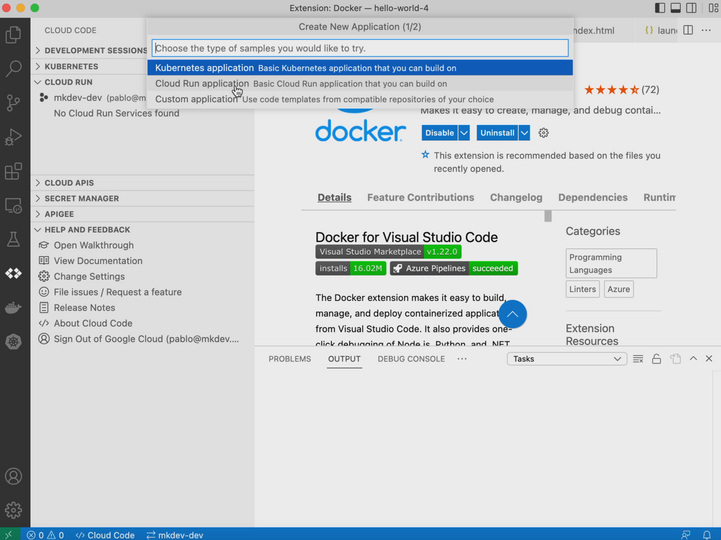
As soon as we do that we have to choose a Cloud Run application as we can see on the screen, Python flask, and trust in the author files.
The next step is to check our code and mark where we want to stop the code when we debug, and this place is good as whatever other place. But before checking that everything is running, we are going to rebuild everything to be able to add our breakpoint.
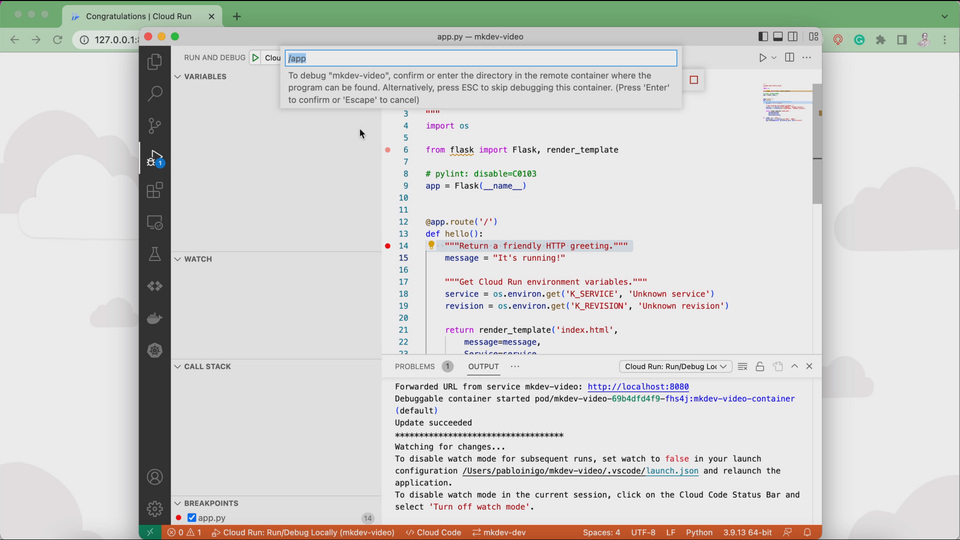
And after everything is rebuilt something is going to happen. The build is going to end in an image up and running in 127.0.0.1:8080. If we open a browser and we go to this URL we will see how automatically Could studio appears and now we can see the code where the breakpoint is.
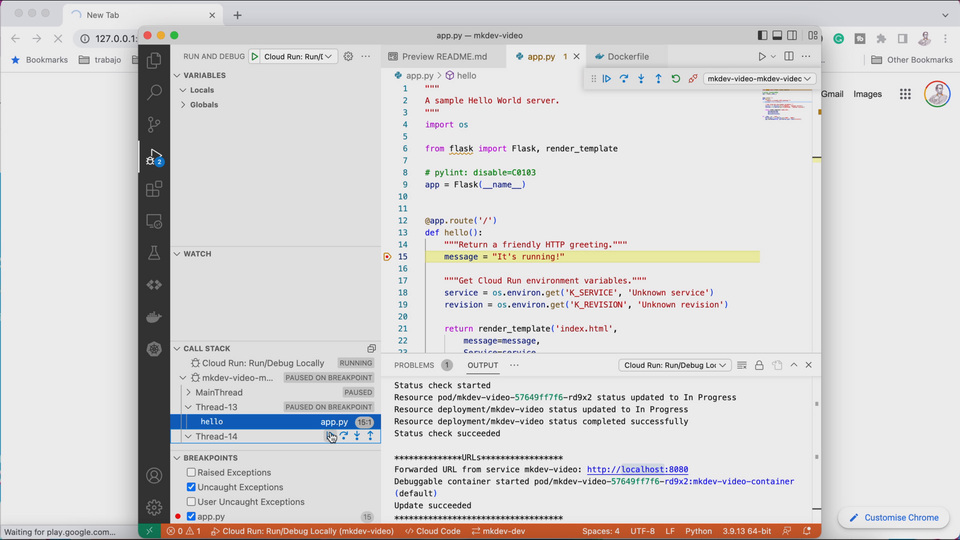
And we can add more breakpoints, and re-execute and add variables to watch, and many other things.
Thanks to Visual Studio we'll be able to debug our containers and we'll find where we have issues.
Here's the same article in video form for your convenience: