Understand your Google Cloud Costs: Billing, Cost Management and Budgets

Today, we are going to explore how billing works in Google Cloud. As you can see on the screen, the first thing we will do is go to the billing section and select the bill we have.
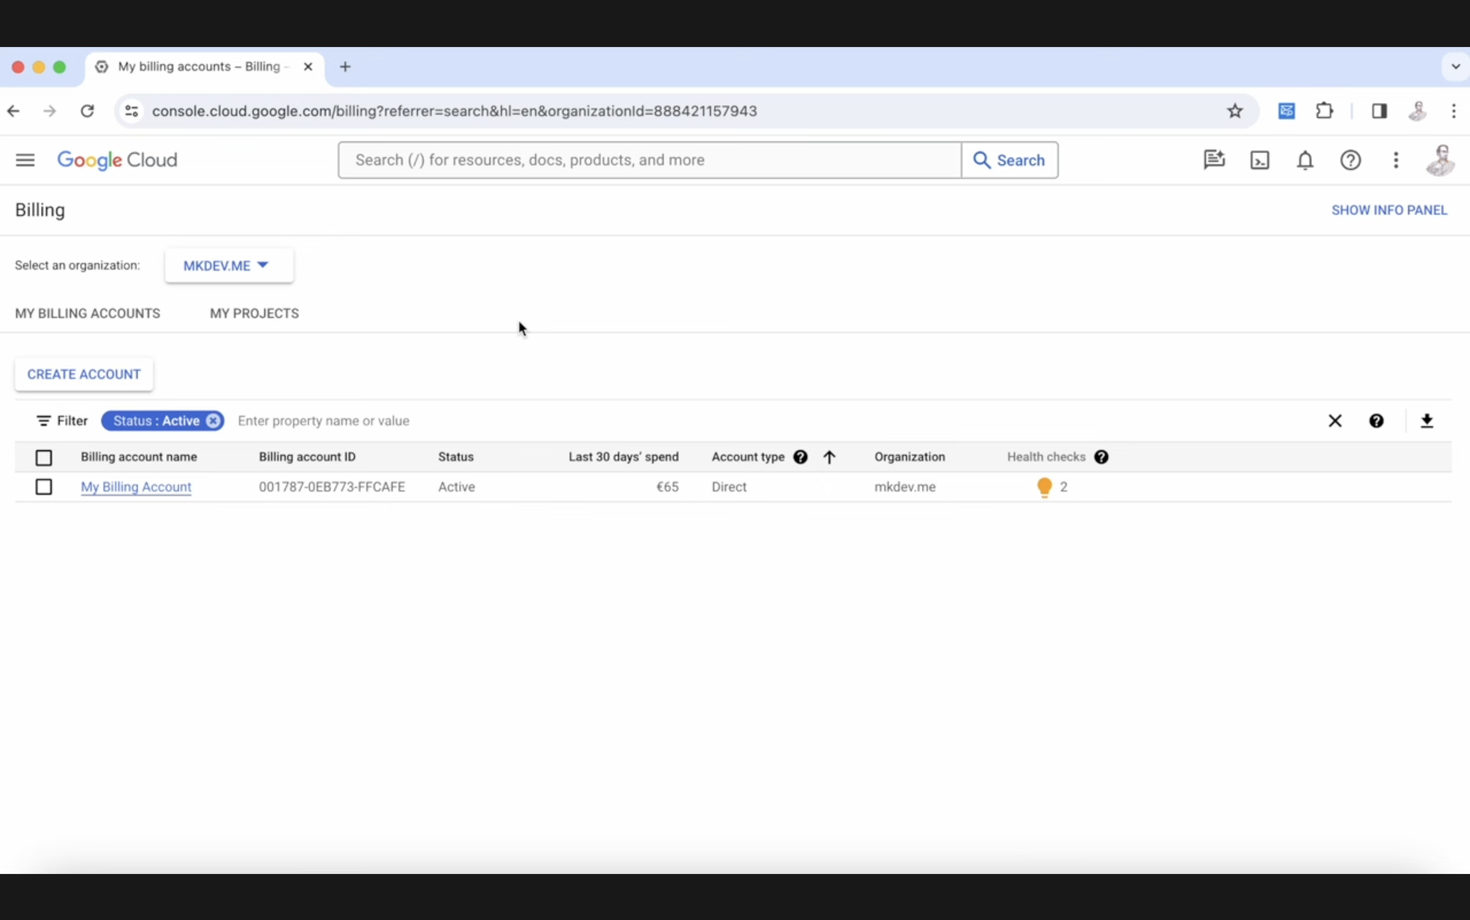
Our goal today is to review the different options available when checking our billing details.
This is a real case, a real scenario. You can see the various costs we have incurred. In this case, we have been assigned a number of credits from Google and we can view the monthly costs.
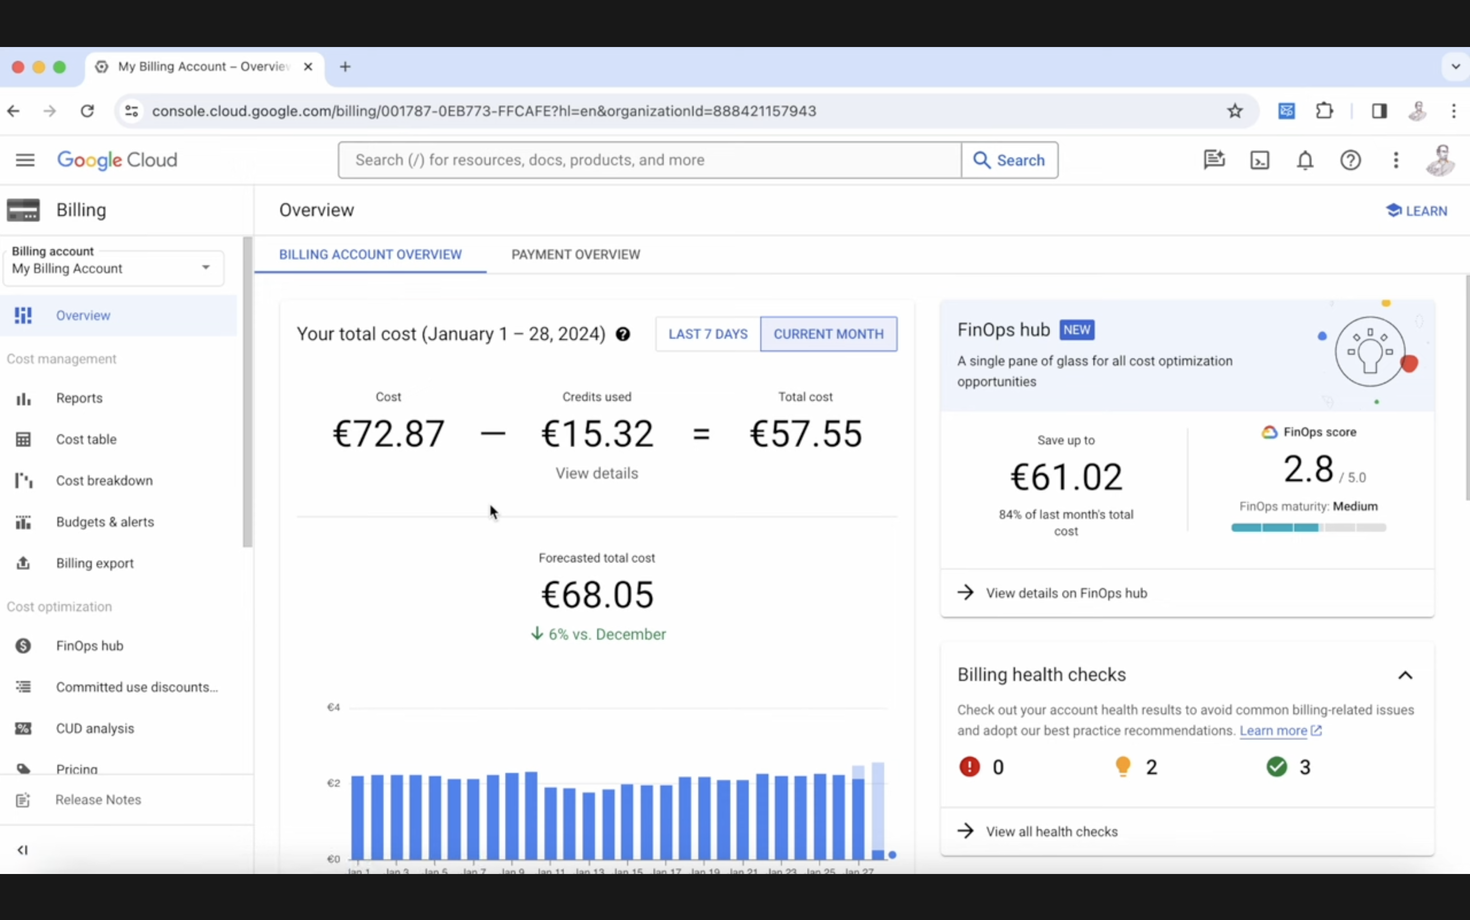
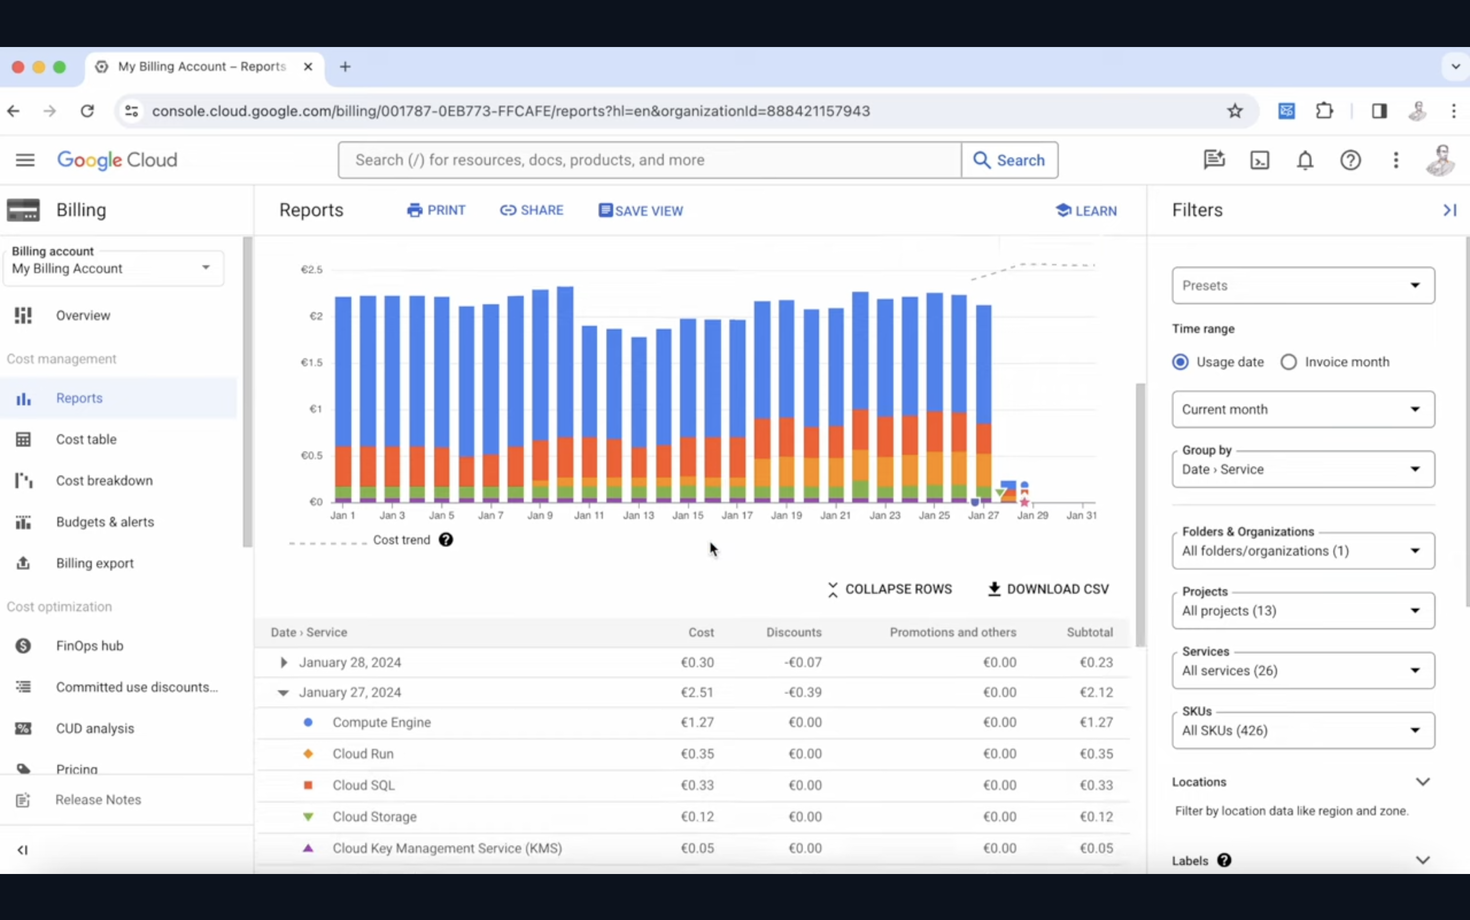
As shown in the report, we can see the different costs we've incurred. For example, in this month's report, in my billing folder, we can select various options. If you only want to see the details for a specific project, let's go to, for example, the "Test" project, and we can see some irregularities.
We were spending a lot of money in this test project. While the expenses were sporadic, they were significant. Let's investigate what could be causing this.
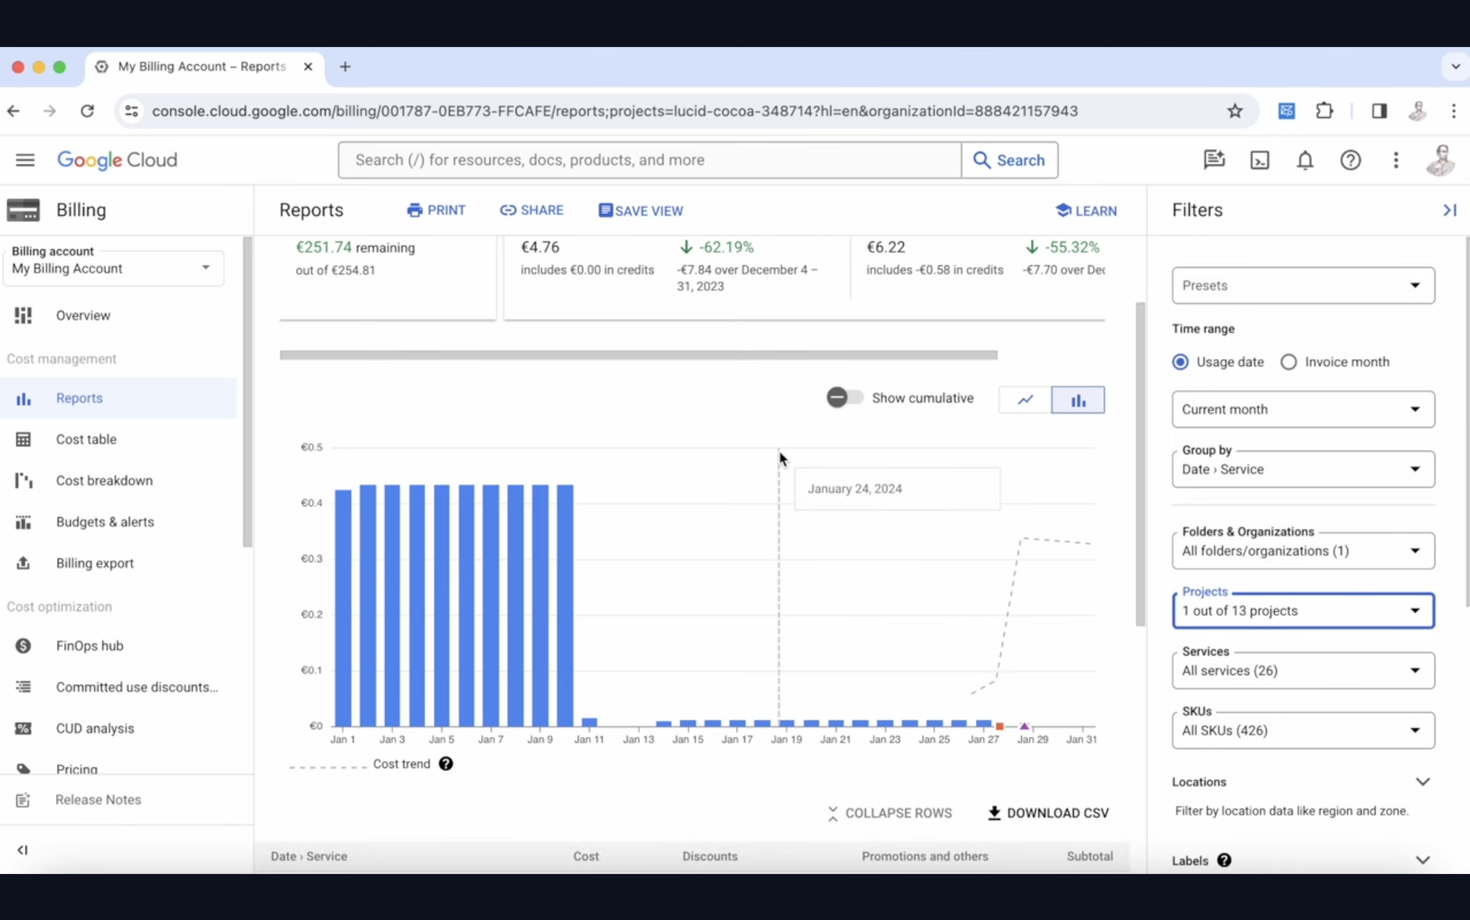
In the "Test" project, we have large expenses due to something unknown. We can see that this compute engine is consuming the most money. However, we don't know what is causing it. To discover this, we should use the "Group by" option. You can group by various components, but in this case, group by service, data service date, and SKU. When we do this, we see that the top expense is for a static IP charge.
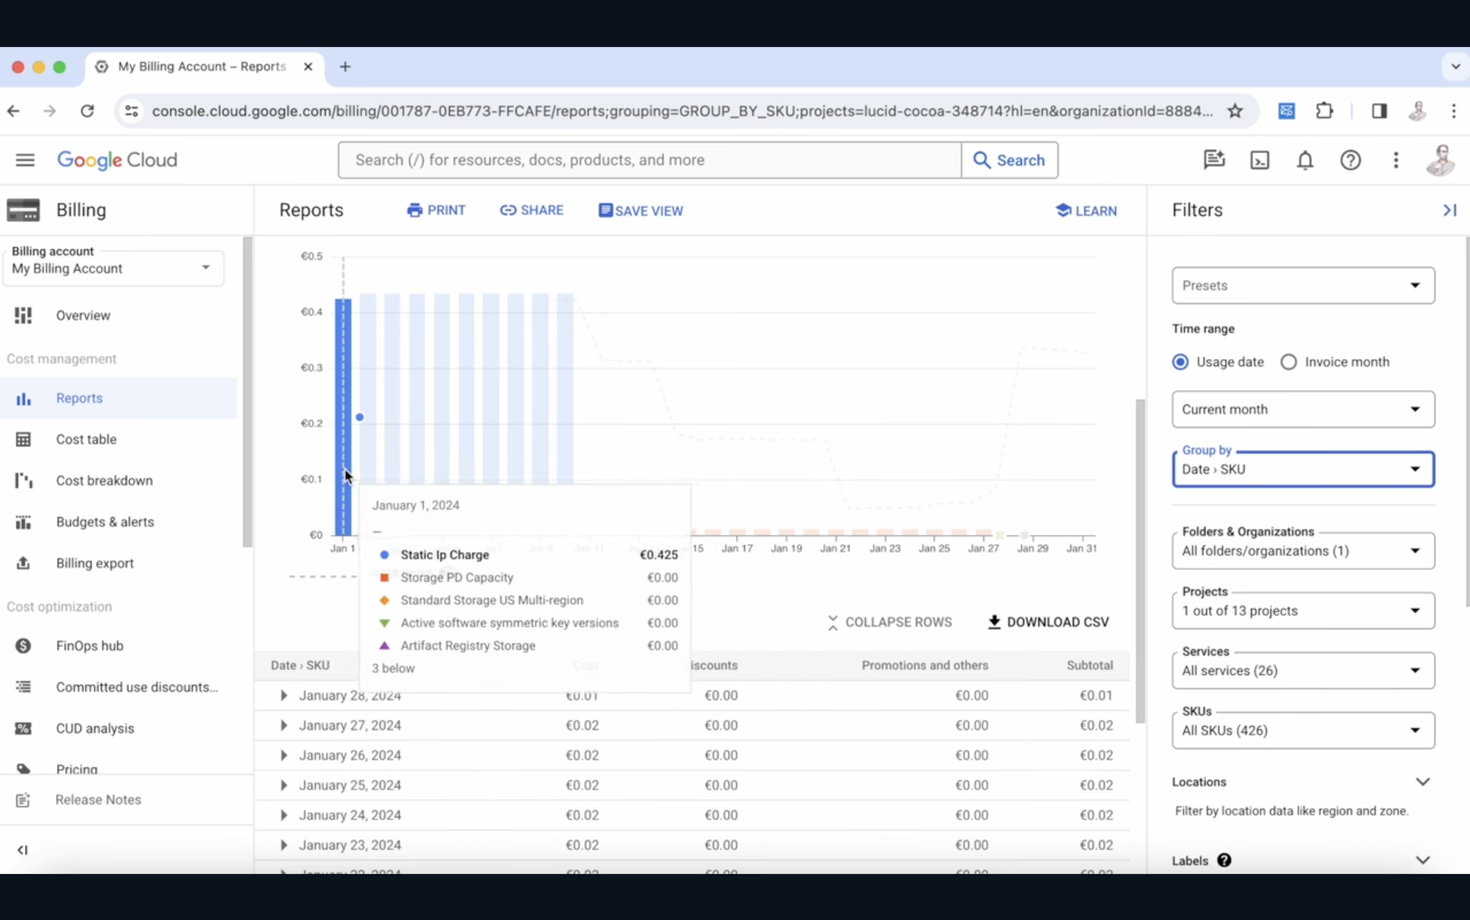
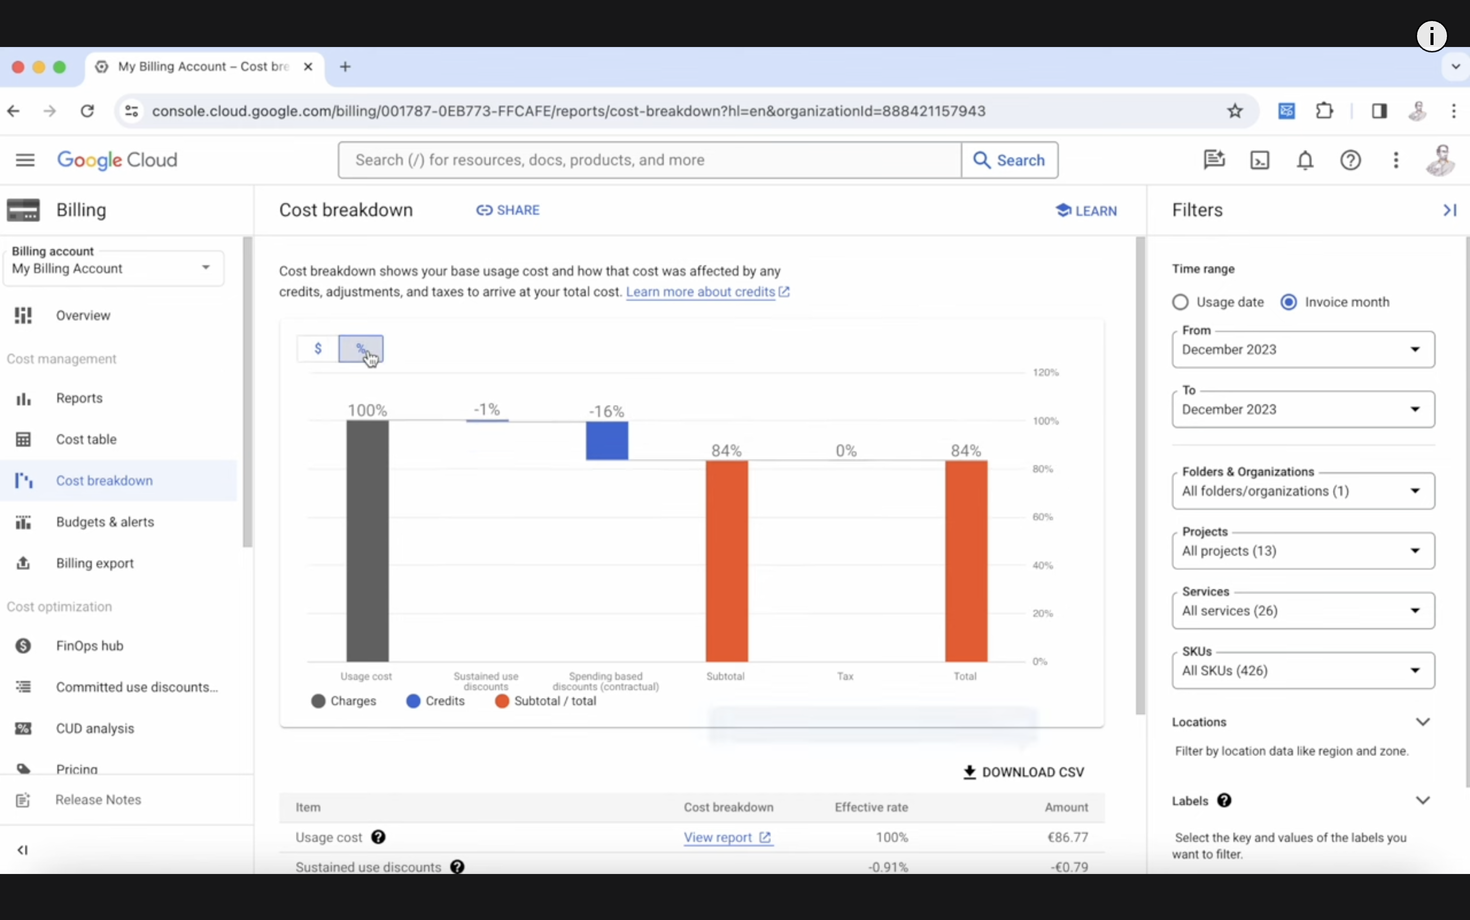
There was a static IP that was active until January 10th. What happened on this day? Someone removed the static IP. Now, we have a small storage cost, but it's minimal. There are different options to view how you are spending your budget. For example, in the cost table or the cost breakdown, you can see the amount in dollars or percentages.
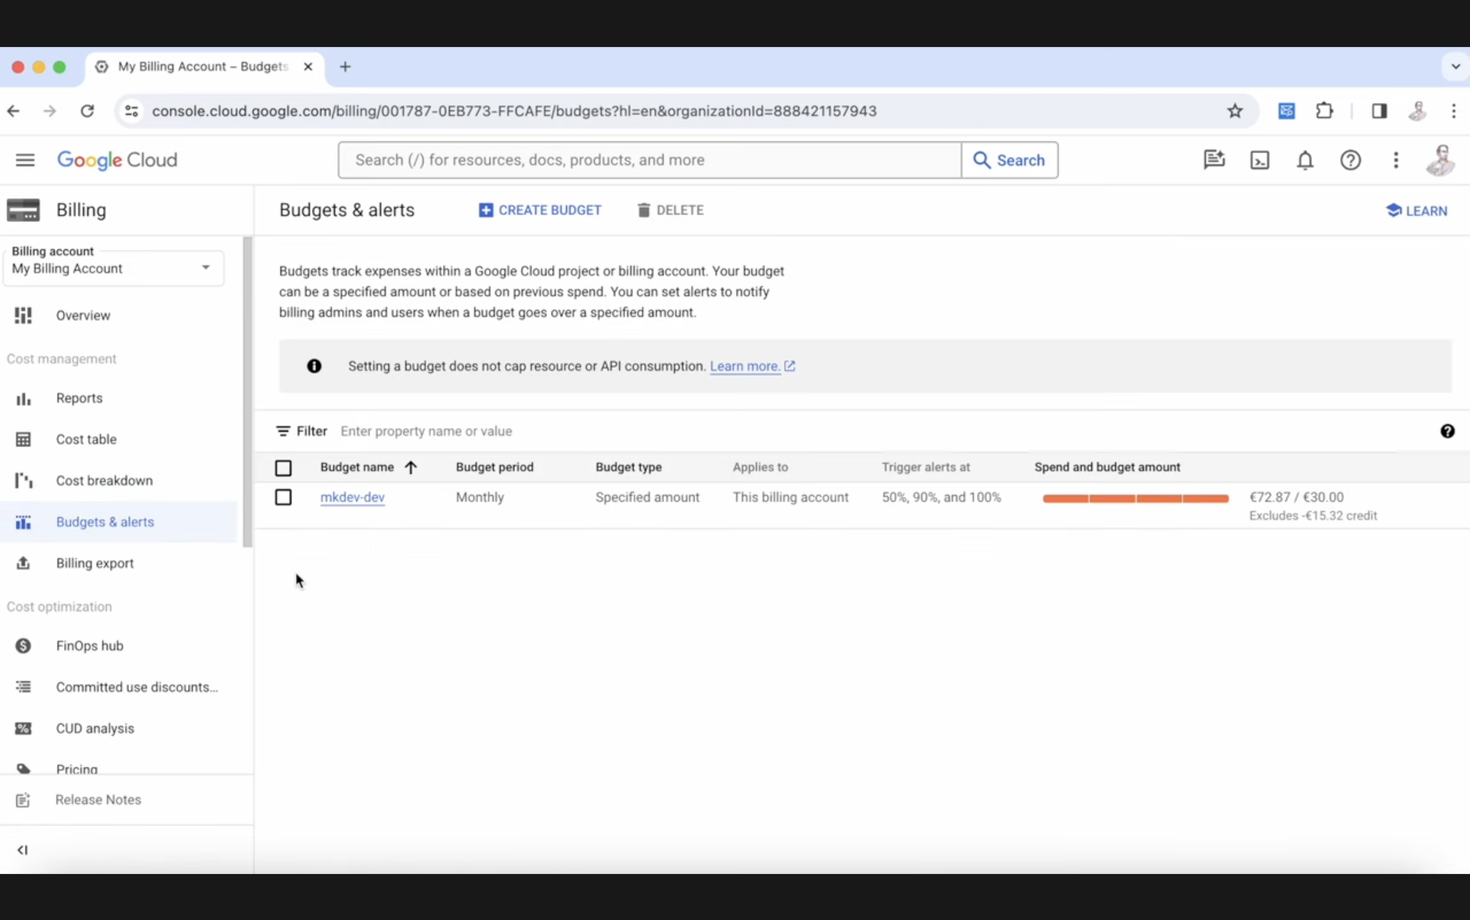
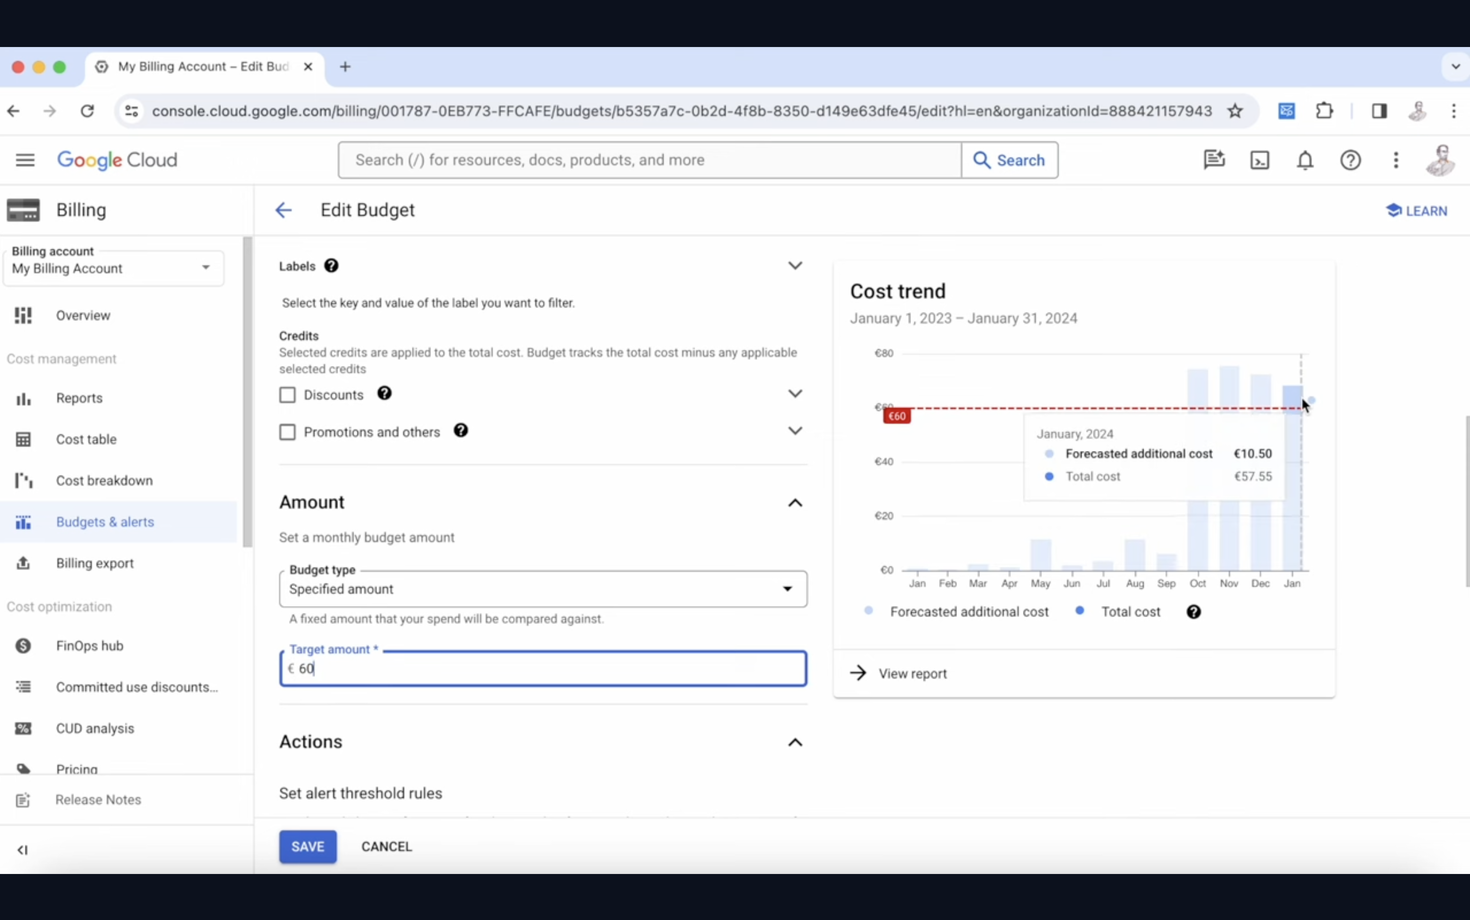
Now, something important for us is the budget and alerts. In the budgeting and alerts section, we set up notifications to alert us when our spending crosses a specific limit. This limit is monetary. For example, as you see here, we have a limit of €30. As soon as we cross this limit, we receive an email alert.
Currently, we have a budget of €30 connected to five projects and all services within this organization. Let's change this month's budget to €60. I set it to €60 because I expect the monthly spend to be around €70. I want to know when this value is crossed. If I receive an email alert on the 10th or 5th of the month, I know something unusual is happening.
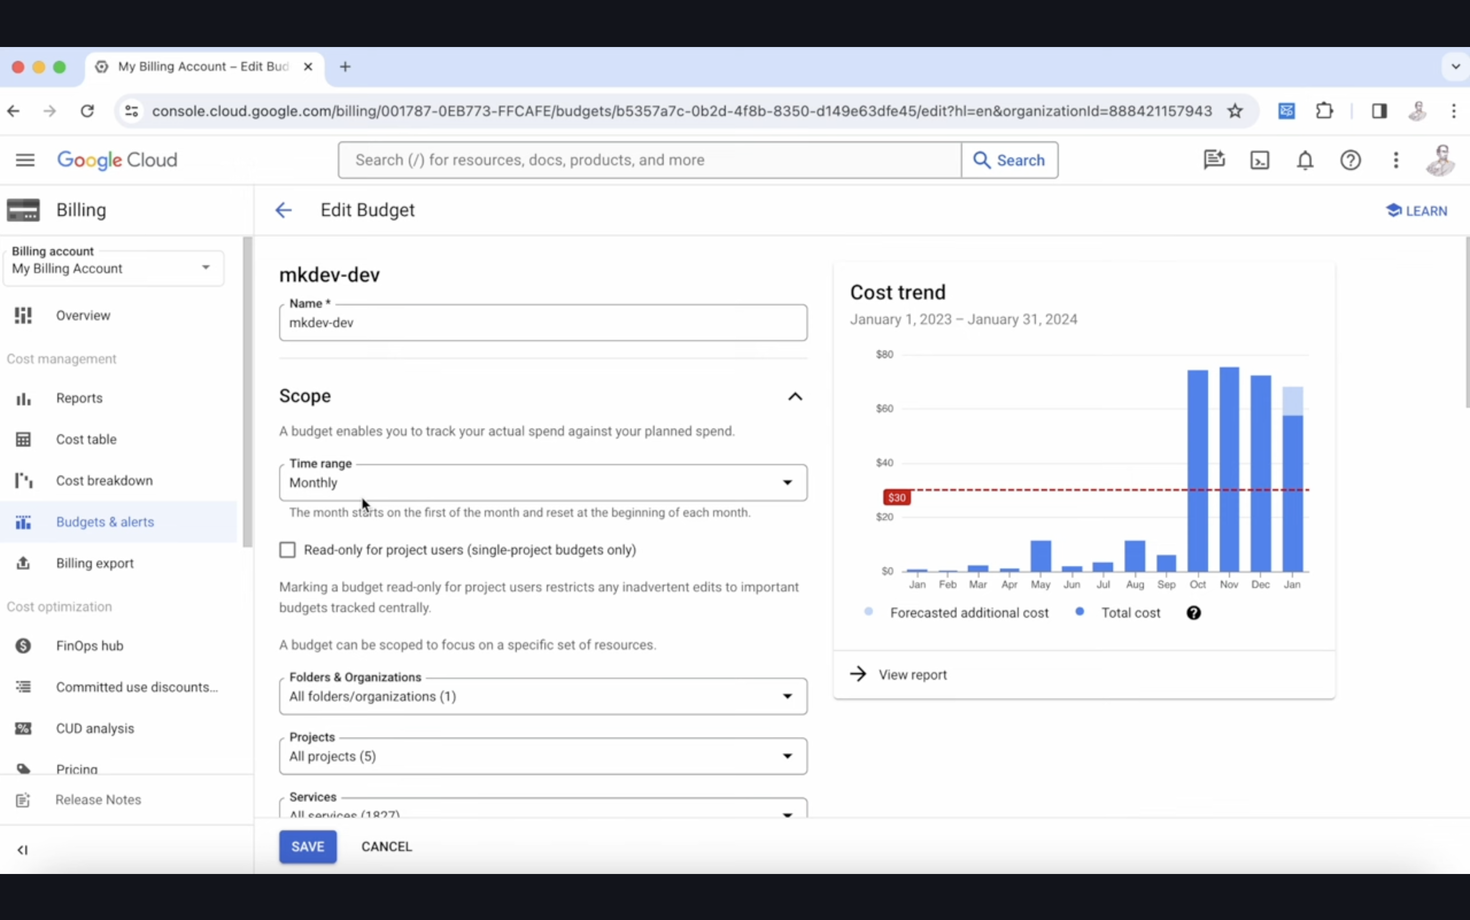
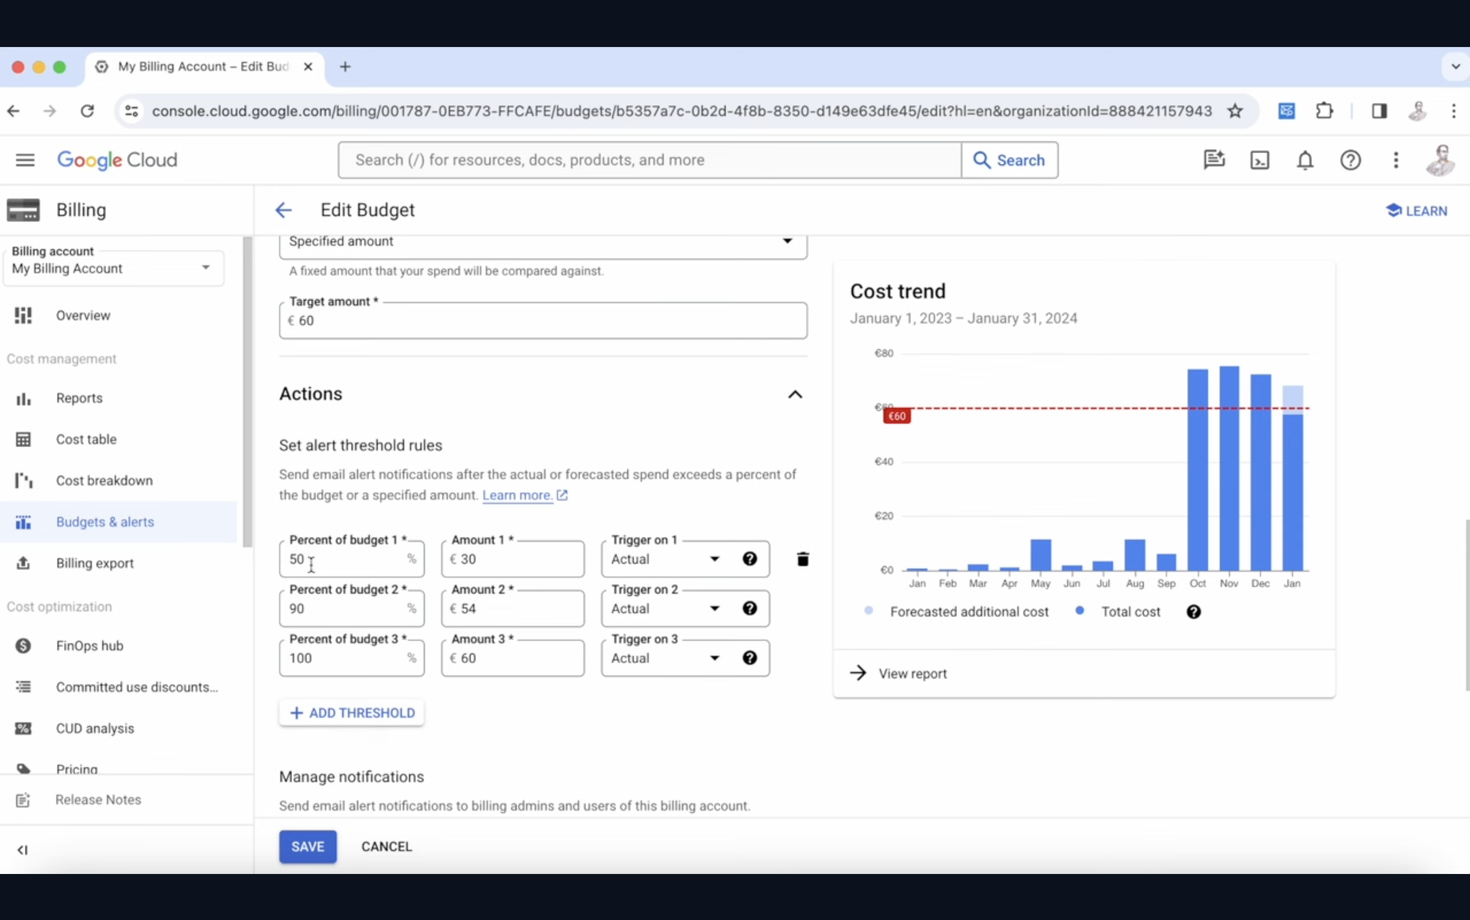
You can set alerts at different thresholds: 50% (€30), 90%, and 100%. Alerts can be sent via email, linked to monitoring email notifications, or connected to a pop-up to trigger an action. This last option is something we will cover in a different article.
If there is no pop-up here, you can create one. For example, if we create a budget just for the "Test" project, we can set it to take specific actions when the budget is reached. If the budget hits 100%, you could kill all the machines or, better yet, stop the machines. This is more efficient. Alternatively, you could disconnect the project from the billing account or send a notification to a Slack channel, informing everyone that the budget has been exceeded.
There are many ways to optimize costs, which we will cover in another article. This article aims to show you how Google Cloud billing works and how you can generate reports.
Cloud infrastructure costs can quickly spiral out of control, leaving you with unexpected expenses. That’s why we’re offering a Free Cloud Cost Audit — to help companies uncover hidden inefficiencies and optimize their cloud spending. Our goal is simple: empower you with actionable insights so you can take control of your cloud budget.
Learn more about the audit and how we can help here, or fill in the application for right away:
Here's the same article in video form for your convenience: