What is a Service Mesh?

This article is sponsored by Allianz Direct. Read about our partnership here.
Let’s talk about Service Mesh.
It might seem like a complex topic, but this complexity mostly comes from a couple of prerequisites for using the Service Mesh.
Service Mesh Prerequisites
Let’s start by defining two prerequisites.
Prerequisite number one: you need to have services that talk to each other. There is no use in Service Mesh if you have a monolith that only talks to itself.
The number of services that can justify a Service Mesh is not set in stone, but it’s safe to say that it starts from somewhere around half a dozen services. You need to know how to organize your applications into a set of microservices, both on a technical and organizational level.
Prerequisite number two: you need to use Kubernetes. Most of the modern Service Mesh technologies were built for containerised applications running inside Kubernetes.
Your infrastructure teams need to know how to run Kubernetes Clusters, and your development teams need to know how to package and deploy those microservices on Kubernetes.
We are not going to dive deep into any of those two prerequisites and you can safely skip the rest of this article if you do not fulfill them.
And by the way, if you don’t - contact mkdev for consulting on transition from monolith to microservices and on introducing containers and Kubernetes into your organisation. We will help you to get there, and afterwards come back to the Service Mesh topic.
With prerequisites fulfilled, we need to talk about 3 different topics: traffic management, observability and security.
DevOps consulting: DevOps is a cultural and technological journey. We'll be thrilled to be your guides on any part of this journey. About consulting
The path to Service Mesh: Traffic Management
To talk about traffic management in Kubernetes, we should first discuss Kubernetes Ingress resources.
Ingress allows you to expose a Kubernetes Service to the outside world.
Kubernetes itself does not know how to process Ingress objects properly. You need to run a special Ingress Controller, that is responsible for processing Ingress objects and makes sure everything is in place to get traffic to your pods.
Production-grade, sophisticated Ingress Controllers provide a lot of advanced features around traffic management. Let’s take a look at just a few of them:
- Rate limiting
- To protect your backend API from too much traffic, you can limit the amount of requests allowed from a single source
- Traffic split
- Traffic splitting allows you to implement canary deployments, by directing a small number of requests to a new version of your application
- Custom headers injection
- You can inject special security headers automatically, without the need to modify your application
There are many other ways to control the traffic - a proper Ingress Controller allows you to fine-tune how you want the requests to reach your pods.
Ingress controllers are meant to be used for the external world. But what if you want to gain the same traffic management features, but for the internal service-to-service communication? For example, you might have a backend API that is used by a couple of other services. It would be quite cool to add some rate-limiting to this API, as well as to perform canary deployments.
One option would be to re-use Ingress Controller for the same purpose.
While possible, the problem is that all of your service-to-service communication would have to go through the single load balancer, essentially a single point of failure to your infrastructure.
Alternatively, you could run one load balancer per service - which might get quite expensive in the case of cloud load balancers, or result in a big maintenance overhead in the case of open source solutions like Nginx controller.
Another option is to make advanced traffic management a part of your application. If you have more than one programming language in the company, then it might be a bit hard to keep things up to date and consistent.
While both options are not that convenient, you can achieve the required result with both of them - in case you need such advanced traffic management, of course.
And if you do need advanced traffic management, then you probably also want to gain a bit more insights into your traffic. This brings us to the observability topic.
The path to Service Mesh: Observability
There are plenty of metrics exposed by Kubernetes, and there are also a lot of metrics from the Ingress Controller. In addition, you can also expose any custom metrics from your application directly.
Once you have metrics from 3 different sources, it’s just a matter of writing correct Prometheus queries and building proper Grafana dashboards to visualize all of this. You need to make sure that those queries and dashboards are generic enough to fit any existing and future microservices inside your cluster.
An additional challenge with microservices is that they constantly talk to each other. The frontend service might talk to the service responsible for processing orders, which talks to the payment service, which talks to the invoicing service. The more services you have, the more complex dependencies between them can become.
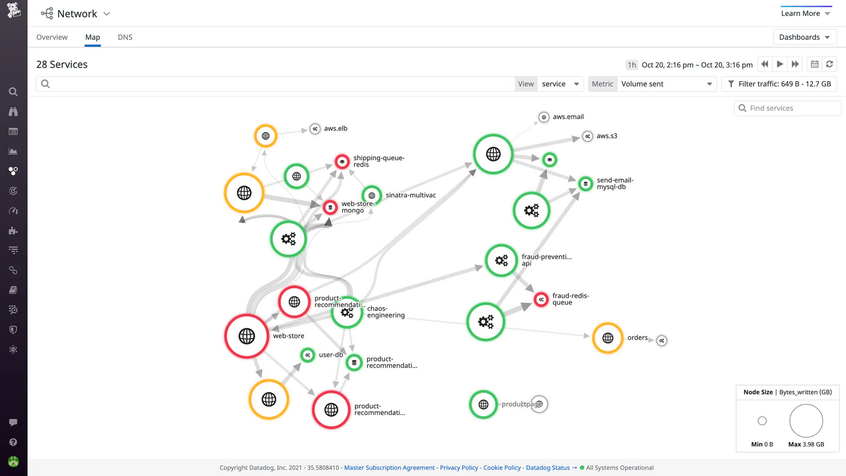
So in addition to per-service metrics, you also want to have some kind of visualization of all services and links between them. One way to get such a nice overview is to use a third-party monitoring solution, like DataDog or NewRelic, that has this kind of overview:
Another option is to use some open-source solution, for example, Cilium with Hubble.
Once you have all the metrics and tools to visualise them configured, you will get a lot of insights into how traffic flows between your services. What you might find out as a result, is that there are some unwanted connections happening. At this point, you might need to look into the security topic.
The path to Service Mesh: Security
Kubernetes does not address service-to-service security concern. But in real world, you would often want to restrict which services or pods can talk to each other.
Kubernetes has native NetworkPolicies, that allow restricting communication between pods on Layer 3 - essentially, it’s a Kubernetes-native firewalling. You only need to install an additional network plugin that knows how to process NetworkPolicies, and then you can simply say that pods with these labels can not be accessed by any pods except the ones from that service.
But firewall alone is not enough for a multi-layered security. You should also give your pods some kind of identity and configure authorisation between pods based on this identity.
You can implement such a layer of security by using ServiceAccounts with some external solution on top, like Oauth2-proxy, that allows you to re-use ServiceAccount tokens to establish oauth2-based permissions between services.
Another similar solution is to use ory/oathkeeper that authenticates, authorizes, and mutates incoming HTTP(s) requests. Inspired by the BeyondCorp / Zero Trust white paper. Written in Go. , to achieve roughly the same result.
Finally, it would be pretty nice to encrypt complete communication between your services. Even internal traffic ought to be encrypted, which requires managing a lot of certificates inside each pod. You can get this functionality from one of the aforementioned tools, or use some other tools focused only on traffic encryption.
Let’s put it all together
We’ve outlined quite a few things that your microservices environment might need.
If you need advanced traffic management, there is a set of tools and approaches to implement it.
If you need full observability of your service communication, there is another set of tools that you need to duct tape together.
And if you have particular security needs, there are yet some more options and tools that you can implement.
It’s totally fine to take the best tool for the job and use it to solve your particular requirement, be it canary deployments or full traffic encryption.
But quite often, your infrastructure has more than one such requirement, potentially a few of them from each group we discussed.
And while nothing can stop you from solving each problem individually, and introducing half a dozen or more different tools, and even more processes and automation on top of this, there is one special tool that might solve all of those requirements at once: this tool is, as you might have guessed by now, a Service Mesh.
Service Mesh
There are, by now, dozens of different Service Meshes, each with its own slightly different set of features, and many with its own approach to implementing it. But if we look from above, each Service Mesh aims to solve the following problem:
Provide a single, easy-to-use solution to enhance the traffic management, observability, and security of your infrastructure.
Any production-ready Service Mesh allows you to fine-tune how the traffic flows between the services, adds out-of-the-box observability on top of this traffic management, quite often already with a nice web UI, and then provides many features around securing the inter-service communication, with advanced authorization policies.
The way it works, in most cases, is by injecting an additional container with a special proxy to all of your pods. This injection can be done manually, but normally it’s something that Service Mesh will do for you.
This proxy stands in front of your application container and takes care of the aforementioned features, like rate limiting and retries, and then, if needed, simply forwards the request to your application.
Your application does not need to be modified, everything will be handled by the Service Mesh. The combination of all of this little proxies in your pods is something called the “Data Plane” of the Service Mesh.
In addition, there is a central component in each Service Mesh, called “Control Plane” - it is the one that configures the proxies, provides a nice dashboard and handles anything else that requires centralized control.
So, on a technical level, Service Mesh is nothing but a bunch of proxies inside each of your pods, coordinated and managed from a central component. Why is it useful?
Why Service Mesh?
There is a number of reasons why Service Mesh might be a good idea for your environment.
We already discussed the first reason - if you need any of the advanced traffic management, observability, and security features, then the simplest way to get all of them at once is to roll out a Service Mesh. Keep in mind that if the only thing you need is canary deployments, then deploying a Service Mesh is likely an overkill. You only need a Service Mesh, if you need at least a few features from at least 2 of the 3 areas that it covers.
The second reason is that thanks to the way Service Mesh works, you can decouple a lot of infrastructure-specific features from the application itself.
The infrastructure team can benefit from the traffic management and observability features, without changing the applications.
The security team, probably together with the infrastructure team, can easily implement the best practices in terms of encryption, authorization, and authentication with just a few lines of simple configuration.
Developers most likely won’t even need to be concerned with any of this, as the Service Mesh is none-intrusive to the applications. On the other side, DevOps-oriented developers will for sure appreciate how easy Canary and blue/green deployments, A/B tests, and a few other traffic management features become with the service mesh.
Why not Service Mesh?
Even though the benefits of the Service Mesh should be clear at this point, there are also some drawbacks.
As mentioned before, if you do not need all of those features, or you need just 1 or 2 of them, then adding a Service Mesh will only result in extra maintenance for everyone.
The proxies that most Service Meshes introduce into your stack are not free - they result in both latency increase and extra resource consumption.
While Service Mesh is supposedly a much simpler way to achieve advanced traffic management, observability, and security, it’s by no means a walk in the park to properly implement and manage it.
With that said, let’s quickly mention a few other traits of the Service Mesh.
Is it only for Kubernetes?
One question is - is Service Mesh just for the Kubernetes? After all, we’ve mentioned Kubernetes to be a prerequisite. The answer is - mostly, yes, but some of the Service Meshes allow you to mesh none-Kubernetes workloads into your Service Mesh.
It involves way more maintenance than using it inside Kubernetes, but in certain scenarios, it might bring some benefits to integrating legacy workloads into your cloud-native environment.
What’s next?
To re-cap, Service Mesh is an all-in-one solution to provide advanced traffic management, end to end observability, and security to your stuck. It works by building a data plane with all of your workloads with the help of a special proxy, and a control plane, that, well, controls all of it from a central spot.
In the next article, we will compare some of the most popular and mature service meshes, as well as discuss some of the things you should look at when picking a Service Mesh for your stuck.
Here's the same article in video form for your convenience: