Black-box monitoring with AWS CloudWatch Synthetics

When you have a new application running, especially if you are a small startup, you probably don't want to think too much about monitoring.
Your full focus is on building the product, and not on setting up metrics and logs collection, configuring thresholds for alarms and so on.
At the same time, you should still have some way to get notified if your product is broken. This is where black-box monitoring might help a lot.
AWS audit: Huge list of AWS services can be intimidating. We'll help you figure it out and choose the right solution for your business. About AWS audits
White-box vs Black-box
In the book Site Reliability Engineering, authors define two types of monitoring: white-box and black-box.
White-box monitoring is based on metrics exposed by the internals of the system, while black-box is testing externally visible behavior as a user would see it.
White-box monitoring allows you to predict and prevent problems, while black-box monitoring simply tells you that the problem is already there. To give an example, white-box monitoring can tell you that your database will run out of disk space in 2 hours, and black-box monitoring will you that your website is down.
Naturally, you should prioritise white-box monitoring, because you want to prevent problems, not to fix them. But, coming back to the beginning, when you are in a hurry to deliver your MVP or new features, you should start with at least some very basic black-box monitoring.
CloudWatch Synthetics
One way to do black-box monitoring is to use “synthetic monitoring” - this type of monitoring consists of scripts that simulate end user behaviour, normally by using some browser automation tools. You can achieve a lot with this kind of monitoring, because you can simulate any complex user workflows with it.
AWS CloudWatch, monitoring solution for Amazon Web Services, has Synthetics Monitoring feature built in, so if your applications are running on this cloud, you can configure simple black-box monitoring with it. Let’s do this - we are going to configure a simple synthetic test for production environment of Transcripto, a speech to text service developed by mkdev.
By the way, check out our Making a Product web series to learn about building and launching a new product from zero.
We start by going to CloudWatch interface. CloudWatch Synthetics are located under Application Monitoring group and are called “Synthetics Canaries”.
Canaries are individual tests that CloudWatch will perform on the schedule that you define. Let's create one.
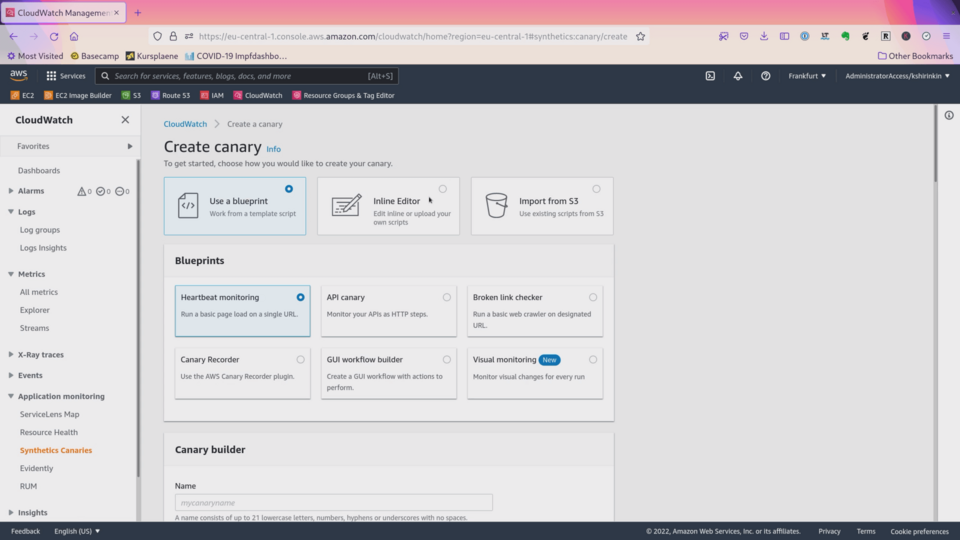
There are many options here, showing how powerful canaries can be. You can, for example, run a canary that makes screenshots of your web application and notifies you if something changed between two screenshots. For now, we are going to use the simplest Heartbeat canary.
I will name my canary transcripto-prod and specify production URL of transcripto here. I don’t want to make screenshots of the page, because it will cost me extra money for storing those screenshots.
Configuring Canary in the end just generates a script that CloudWatch will execute. As I already mentioned, you can build really complex workflows with those scripts, simulating end to end user interactions with your application. You don’t have to know javascript to configure canaries, CloudWatch Synthetics has different ways to generate these scripts for you.
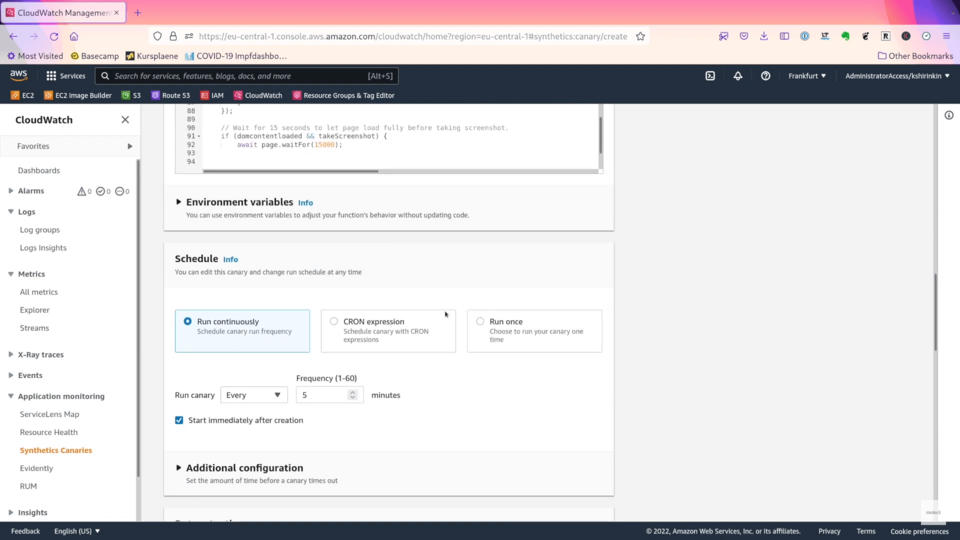
Now let's check the schedule. I want to run this simple heartbeat every 5 minutes and I want it to fail if it takes more than 10 seconds to load.
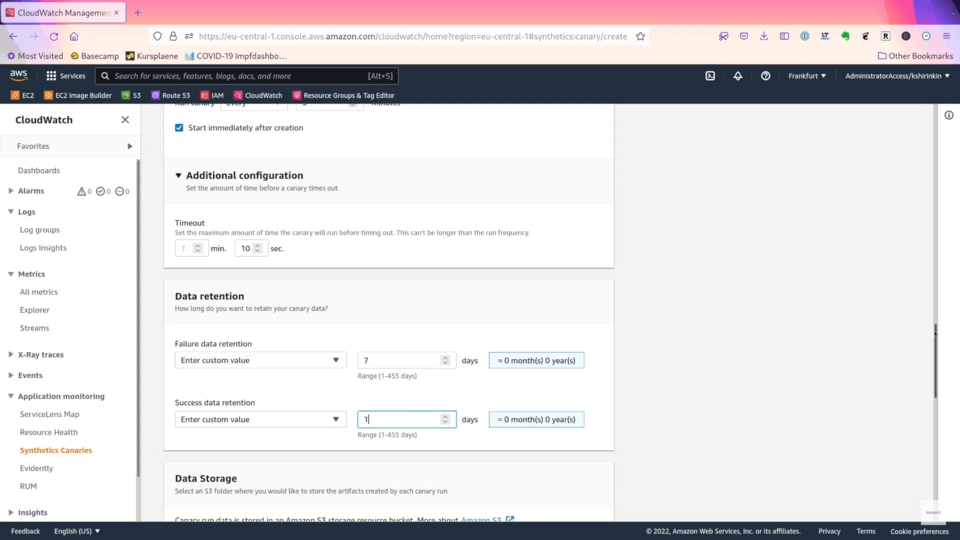
I want to keep only 7 days of failed attempts and 1 day for successful ones - I don't care that much about heartbeats from a month ago.
I am going to store the results in the S3 bucket generated by AWS.
Now it’s time to configure an alarm for failed heartbeats.
I want to get notified if less than 50% of requests were unsuccessful within 5 minute period. My heartbeat runs only once per 5 minutes, so a single failed heartbeat will result in an alarm.
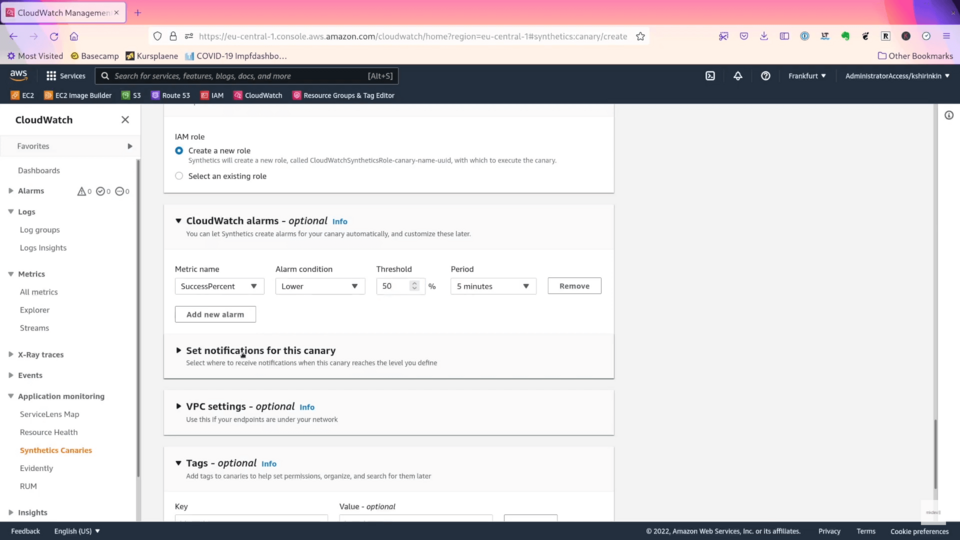
Now I need to configure a notification for this this alarm - I will create a new SNS topic, that will forward notifications to my email address.
Finally, let’s click on Create.
By the way, contact us if you are interested in AWS, DevOps and Kubernetes consulting, training or audit.
It will take few minutes to run the first heartbeat.
While we are waiting, let’s talk about the pricing of those canaries.
Canaries Pricing
A single canary run costs 0.0016$. Let’s calculate how much this heartbeat will cost us. We are going to run this canary 12 times per hour, each hour, which gives us the price of 13$ per month.
If you ask me, I think it’s way too expensive for a simple check if website is up or down. If we run this heartbeat only once an hour, it will cost us only around one dollar per month - which is bit more reasonable, but we will only know that our website is down when the whole world also knows about it.
But there is more in this price. If you look at the examples AWS gives us, you will learn that you also have to pay for AWS Lambda functions that execute our canaries, as well as for CloudWatch logs and S3 storage. Each of those services are not that expensive on their own, but all together, combined with a canary price, it adds up quickly.
If this pricing seems way too unreasonable to you, let’s compare it with a CloudWatch competitor, DataDog.
DataDog differentiates between simple API tests and full browser tests. AWS Synthetics, feature-wise, are browser tests, so we should compare those.
DataDog charges 12$ for 1 thousand test runs - for the same price, we get 7500 canary runs in CloudWatch Synthetics - more than 7 times cheaper than DataDog, and still much cheaper even if we calculate Lambda and storage price of AWS.
For a simple heartbeat though, we would use DataDog API Tests, and those cost way less than CloudWatch Canaries.
Pricing of cloud services can be very tricky and it’s really easy to get a huge bill by not paying enough attention.
By the way, you can hire mkdev to tame your cloud bill and optimise your costs - we will do a full audit of your existing costs and advice how to adjust your infrastructure to be both more cost efficient, scalable and easy to maintain and improve.
Canaries Results
Now let’s get back to the results of our heartbeat.
We can see that we have first successful runs, and we can check the logs of those runs - those logs are actually stored in CloudWatch Logs. If we click on HAR file, we will see a complete breakdown of everything that happened during canary run - how much time it took to load each asset. Metrics tab offers even more data that you can use to learn about behaviour of your system.
Conclusions
We started with the need to configure some basic black-box monitoring for your application.
One way to do it in AWS is to use CloudWatch Synthetics. Synthetic Monitoring tools allow you to simulate complete user workflows and get plenty of data around each interaction.
Being very powerful tools, they are by no means cheap - as we just saw, such a test will cost you a lot on both in CloudWatch and DataDog, and many similar tools, especially if you want to perform such tests between very small intervals. Given the amount of features and the price, you should use Synthetic Monitoring for more complex use cases, and avoid using them for simple heartbeat that we just configured.
For a simple black-box monitoring, you could find cheaper ways - for example, in AWS you could configure a simple lambda function, triggered with CloudWatch Events - such a setup will cost you a fraction of CloudWatch Synthetics, even if you run this function every few seconds.
Here's the same article in video form for your convenience: