OpenShift 4 Troubleshooting: Your Cluster is Broken, What's Next?

OpenShift 4 brings a lot of great new features around cluster operations.
Things like container operating system, one click cluster updates and machine API make management of the Kubernetes cluster much less of a hassle.
But all of those new technologies, that lay at the core of the OpenShift 4, are quite new.
At some point, something will go wrong and you need to know how to troubleshoot your cluster issues.
In this article, I will give you few tips on how you can figure out what exactly happened with your OpenShift 4 cluster. We will start with examining the OpenShift Console.
First thing you need to know is that OpenShift comes with a complete monitoring stack out of the box.

Every possible metric of every cluster component is collected by built in highly available Prometheus installation.
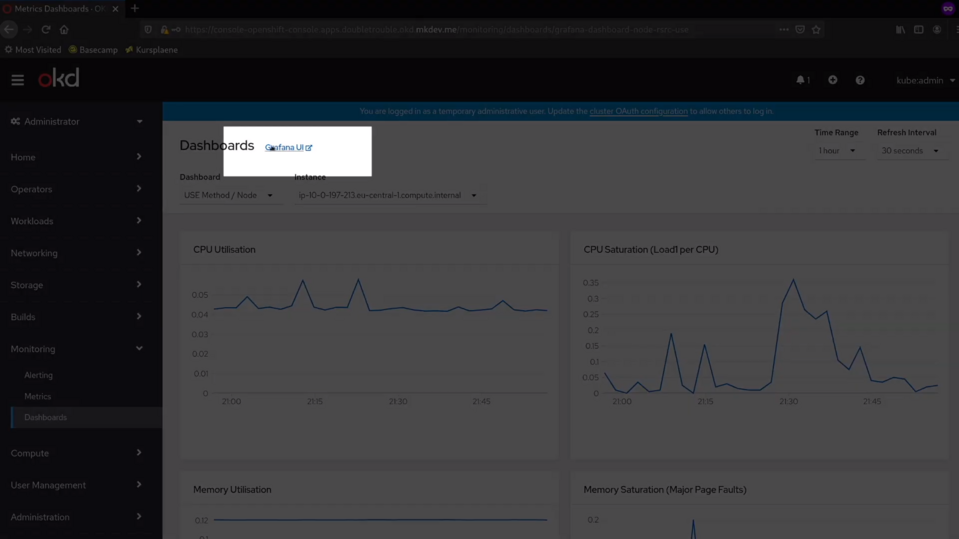
You can examine these metrics directly via the OpenShift Console. There are dozens of prebuilt dashboards. For example, here you can see many many detailed metrics about how etcd cluster is doing.
There are also metrics and dashboards for the complete cluster as well as for the invidibual nodes.

The built in dashboards are great, but there is also a Grafana installation available for you. Inside this Grafana, you have exactly the same dashboards, but you get a bit more flexibility around visualising those metrics.
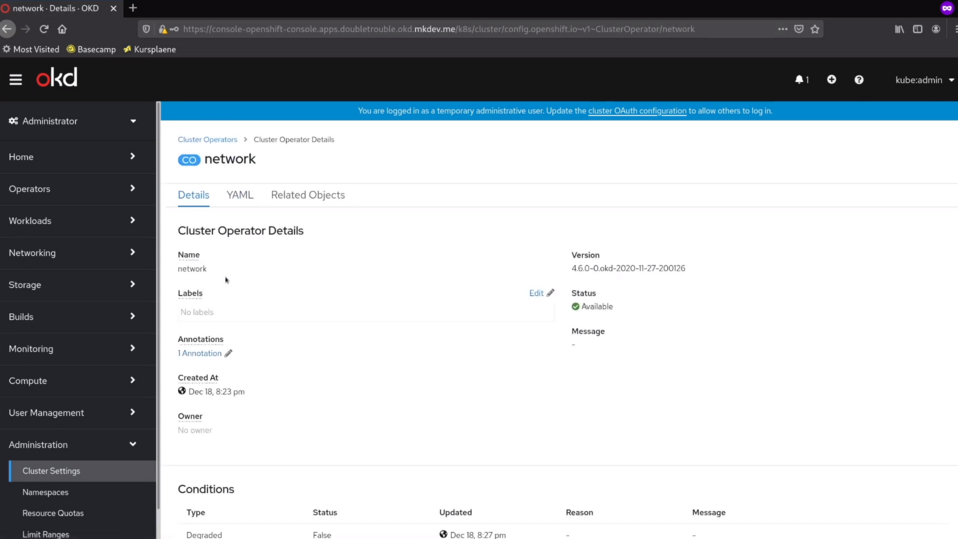
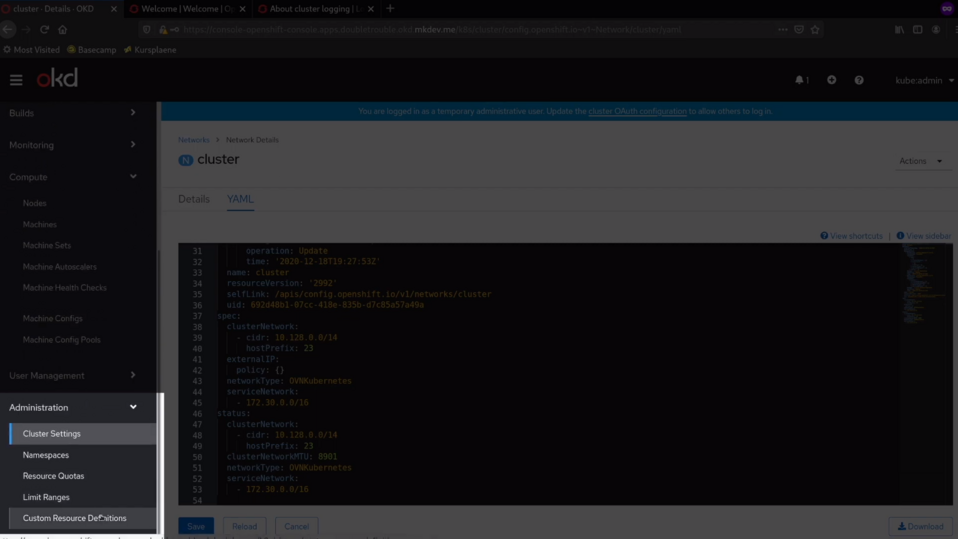
Every part of the cluster is managed by Cluster Operators. You can find the list of those operators in the Cluster Settings section of the console.

In this list you can see if any of the operators has any problems. You can also jump to the individual operator, like I am doing here with the network operator.
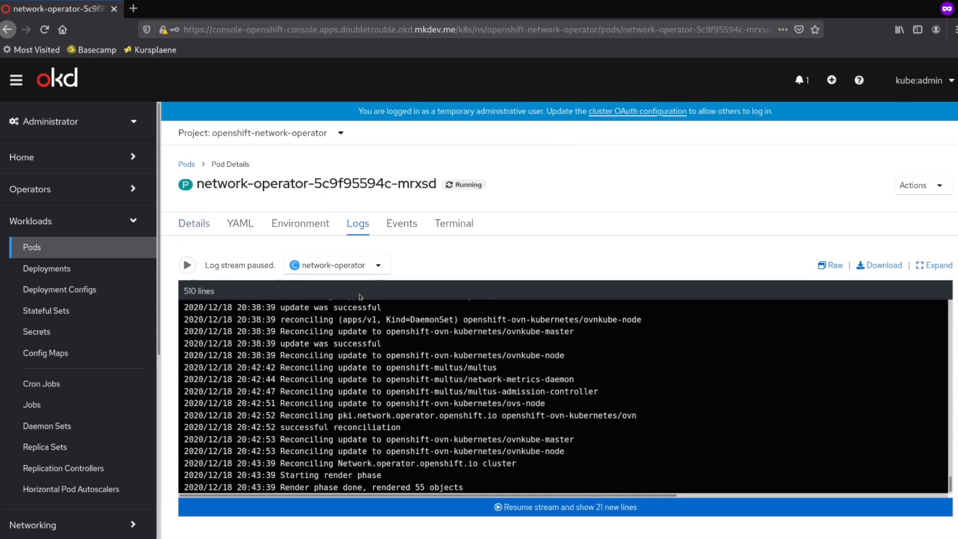
Remember, that each operator is just another container in your cluster, meaning that you can see the logs and metrics of the operator just like any other container.
Talking about logs, you can always check them right here, in the console. The logs you see in the console are take directly from the cluster node where the container is running.
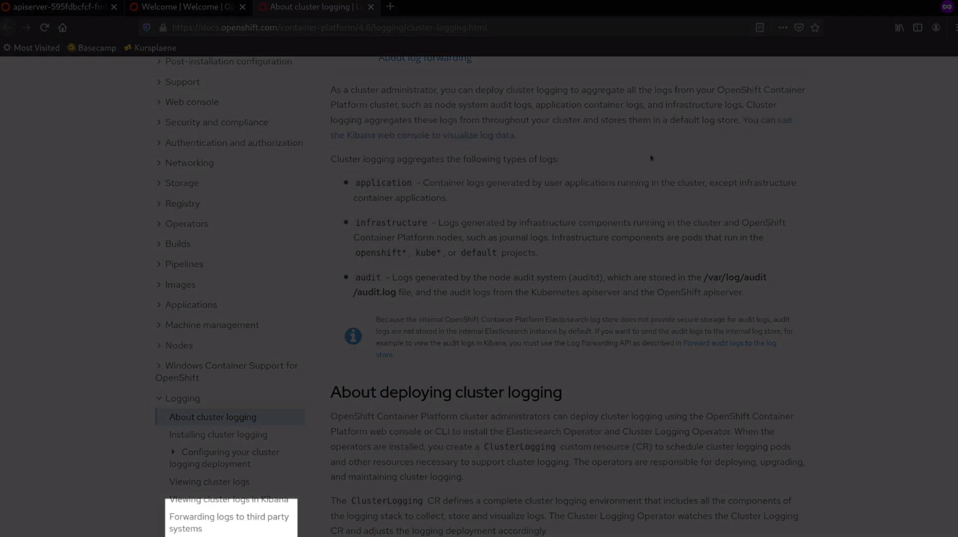
Additionally, you can configure the cluster logging. What it means is you will get the ElasticSearch cluster and Kibana to store the logs for extended periods of time and visualise and analyse them in a more convenient way. There is also an option to forward all the logs to the external log storage of your choice.
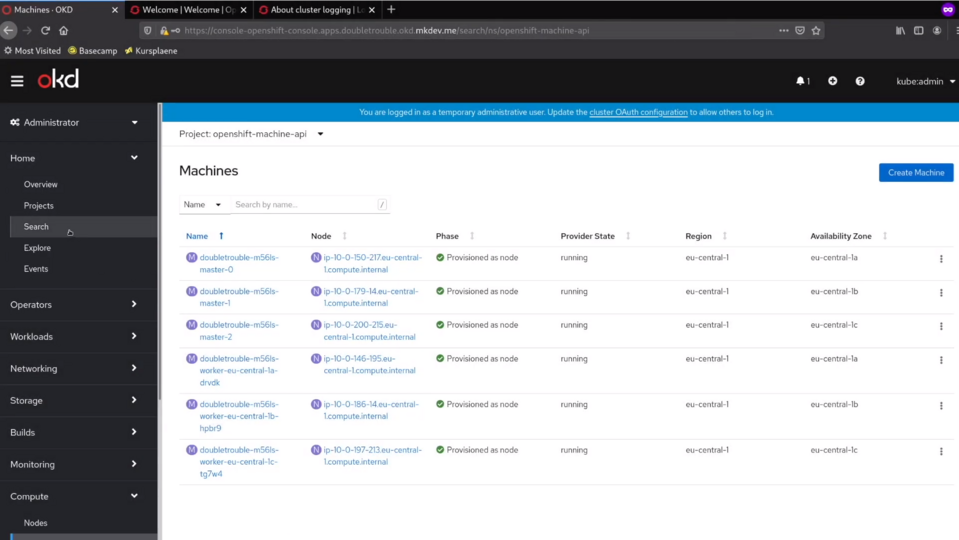
If you have a problem with individual cluster nodes, you can always check them in the Compute section of the console - there are metrics and the current state of each node and machine.
Some of the Kubernetes resources are not visible in a nice way in this console. But you can always find them if you go to the Search section. In this search form, you get a list of all the resource types available in the cluster, and you can also see each resource in details.
Also, you have a list of the Customer Resource Definitions at the bottom of the menu. Many cluster configurations are stored as the customer resource definitions. Once again, you can see each of those resources in details right here, in the console. Naturally, you can also do all of this with the kubectl or the open shift cli.
There are many things you can see in the OpenShift console or with the CLI.
But sometimes your cluster is so broken, that none of those options are available.
In this case, it helps to have some way to login to the cluster nodes directly, with SSH or a tool like AWS Session Manager.
Once you are inside the node, you have most of the standard Linux utilities to investigate what's wrong with your cluster.

You can check the network state with the ss utility, for example, or you can also verify Iptables. All the logs from each pod on this node are stored right there, so you can inspect them and search through them.


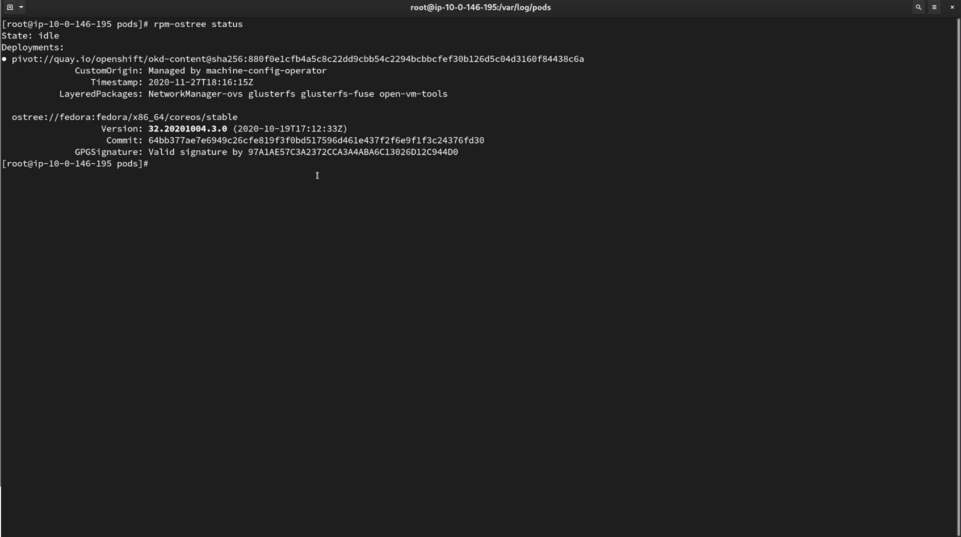
One thing you need to remember is that OpenShift is using CoreOS, so you don't have a normal package management at your disposal. Instead, you can use rpm-ostree command to verify the latest deployment and check if matches your expectations.
Other that that, it's still your regular Linux file tree, so you can see all the configuration files in the /etc directory, if you need to check the container registry configuration that is used by the cri-o, for example.
Naturally, you can check different disk details and overhaul just navigate this node like a normal server. Just keep in mind, that the actual filesystem is a bit special, because of the way OSTree layers it.
Talking about cri-o, this will probably be your main candidate for troubleshooting. There is a crictl tool, that works similar to docker or pod man cli.
You can get the list of all containers running on this node and then, for example, find the etcd container. You can then exec into this container and run etcdctl commands to figure out if it works fine and if all the etcd nodes are okay.

Just remember, that almost everything in OpenShift is running inside the container. On the node level, cri-o is the tool that manages those containers, so crictl should become a big friend of yours.
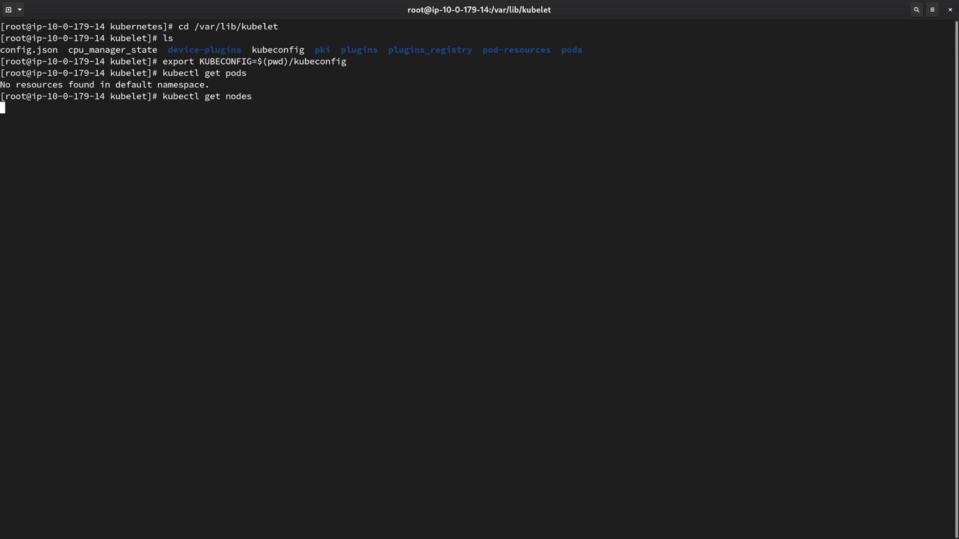
Finally, if you lost a normal way to login to the cluster and query the Kubernetes API, you can login to the control plane node and use the kubeconfig from there to query the API.
The kubeconfig is available at /var/lib/kubelet directory. Kubectl is already installed on each node, so you can just export the KUBECONFIG variable and start investigatign the broken cluster's API as usual.
I hope those tips will help you to fix your cluster if something really wrong will happen with it. Well, I also hope that nothing that bad will happen in the first place, but, as you know, hope is not a strategy, especially in Kubernetes cluster operations.
Cloud Native consulting: regardless if you are just getting started, or looking for a big shift from the old ways to the future, we are here to help. About consulting
Here' the same article in video form for your convenience:
Article Series "OpenShift/OKD Course"
- Production OpenShift Cluster in 35 Minutes: First look at OKD 4 and the new OpenShift Installer
- 3 Core Features of OpenShift 4 Cluster Management: Fedora CoreOS, cri-o and MachineSet API
- How to Configure OpenShift 4 Cluster Nodes: MachineConfig Operator and CoreOS
- OpenShift 4 Troubleshooting: Your Cluster is Broken, What's Next?